CDC: First Test is a Success!
It’s taken two days of fault finding but we succeeded!
Success is a great word! Admittedly this is only the first stage and not even the sensor I eventually hope to use. But success it is! Main issue was an error using SSH with Python Version 2.7.3 which comes preinstalled on the Pi. It took a long time for this bit of code to work.
sudo pip install pyopenssl ndg-httpsclient pyasn1
I then found some other errors – but with line numbers I worked out I’d simply entered an extra digital in the AWS key. It’s hard to explain how excited I am!!


Screen Grab: MET Office Graph of BMP180 Sensor Data
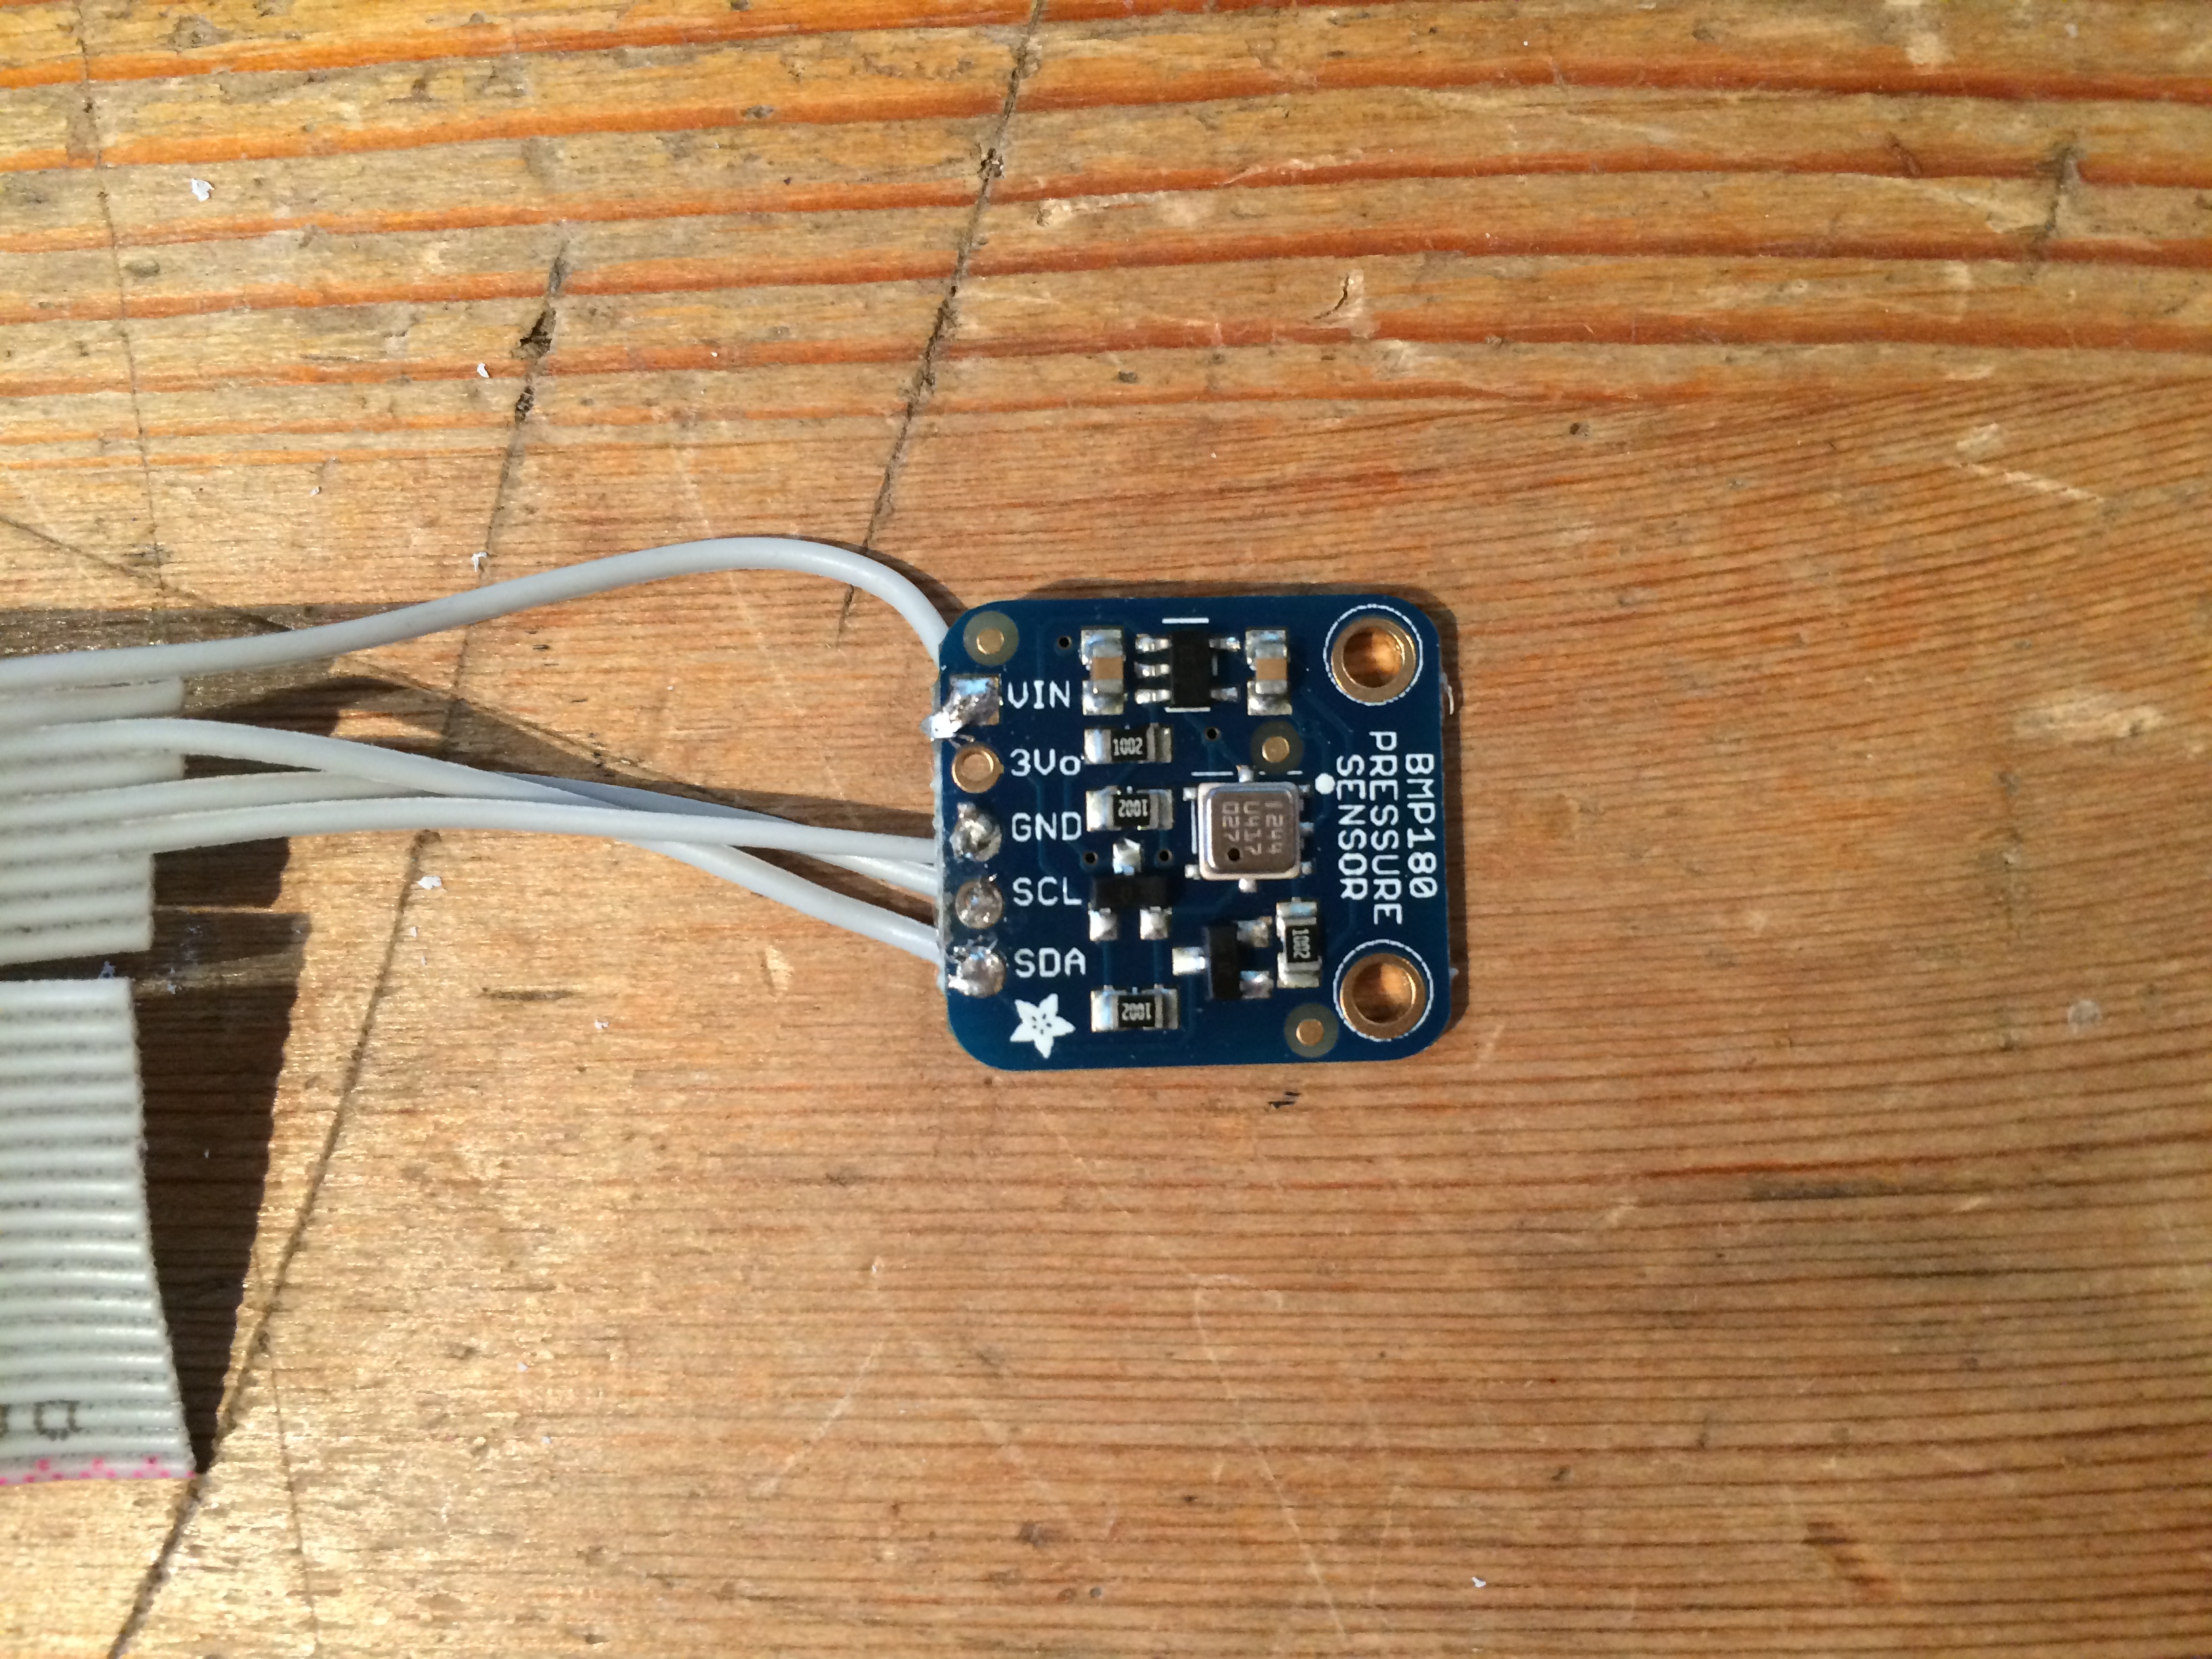
BMP180 Air Temperature and Pressure Sensor
This little sensor, the Bosch BMP180, measures air pressure and temperature. Purchased from Adafruit, it’s connected to the GPIO pins on the Raspberry Pi using a ribbon cable. The eagle eyed among you will notice I used the wrong side of the ribbon cable. I now know the pink coloured side of the ribbon indicates which side is pin 1! It still worked, I just had to plug the cable in the other way round. I would have had trouble putting a case back on the Pi with the ribbon cable inserted like this but that’s not an issue at the moment.
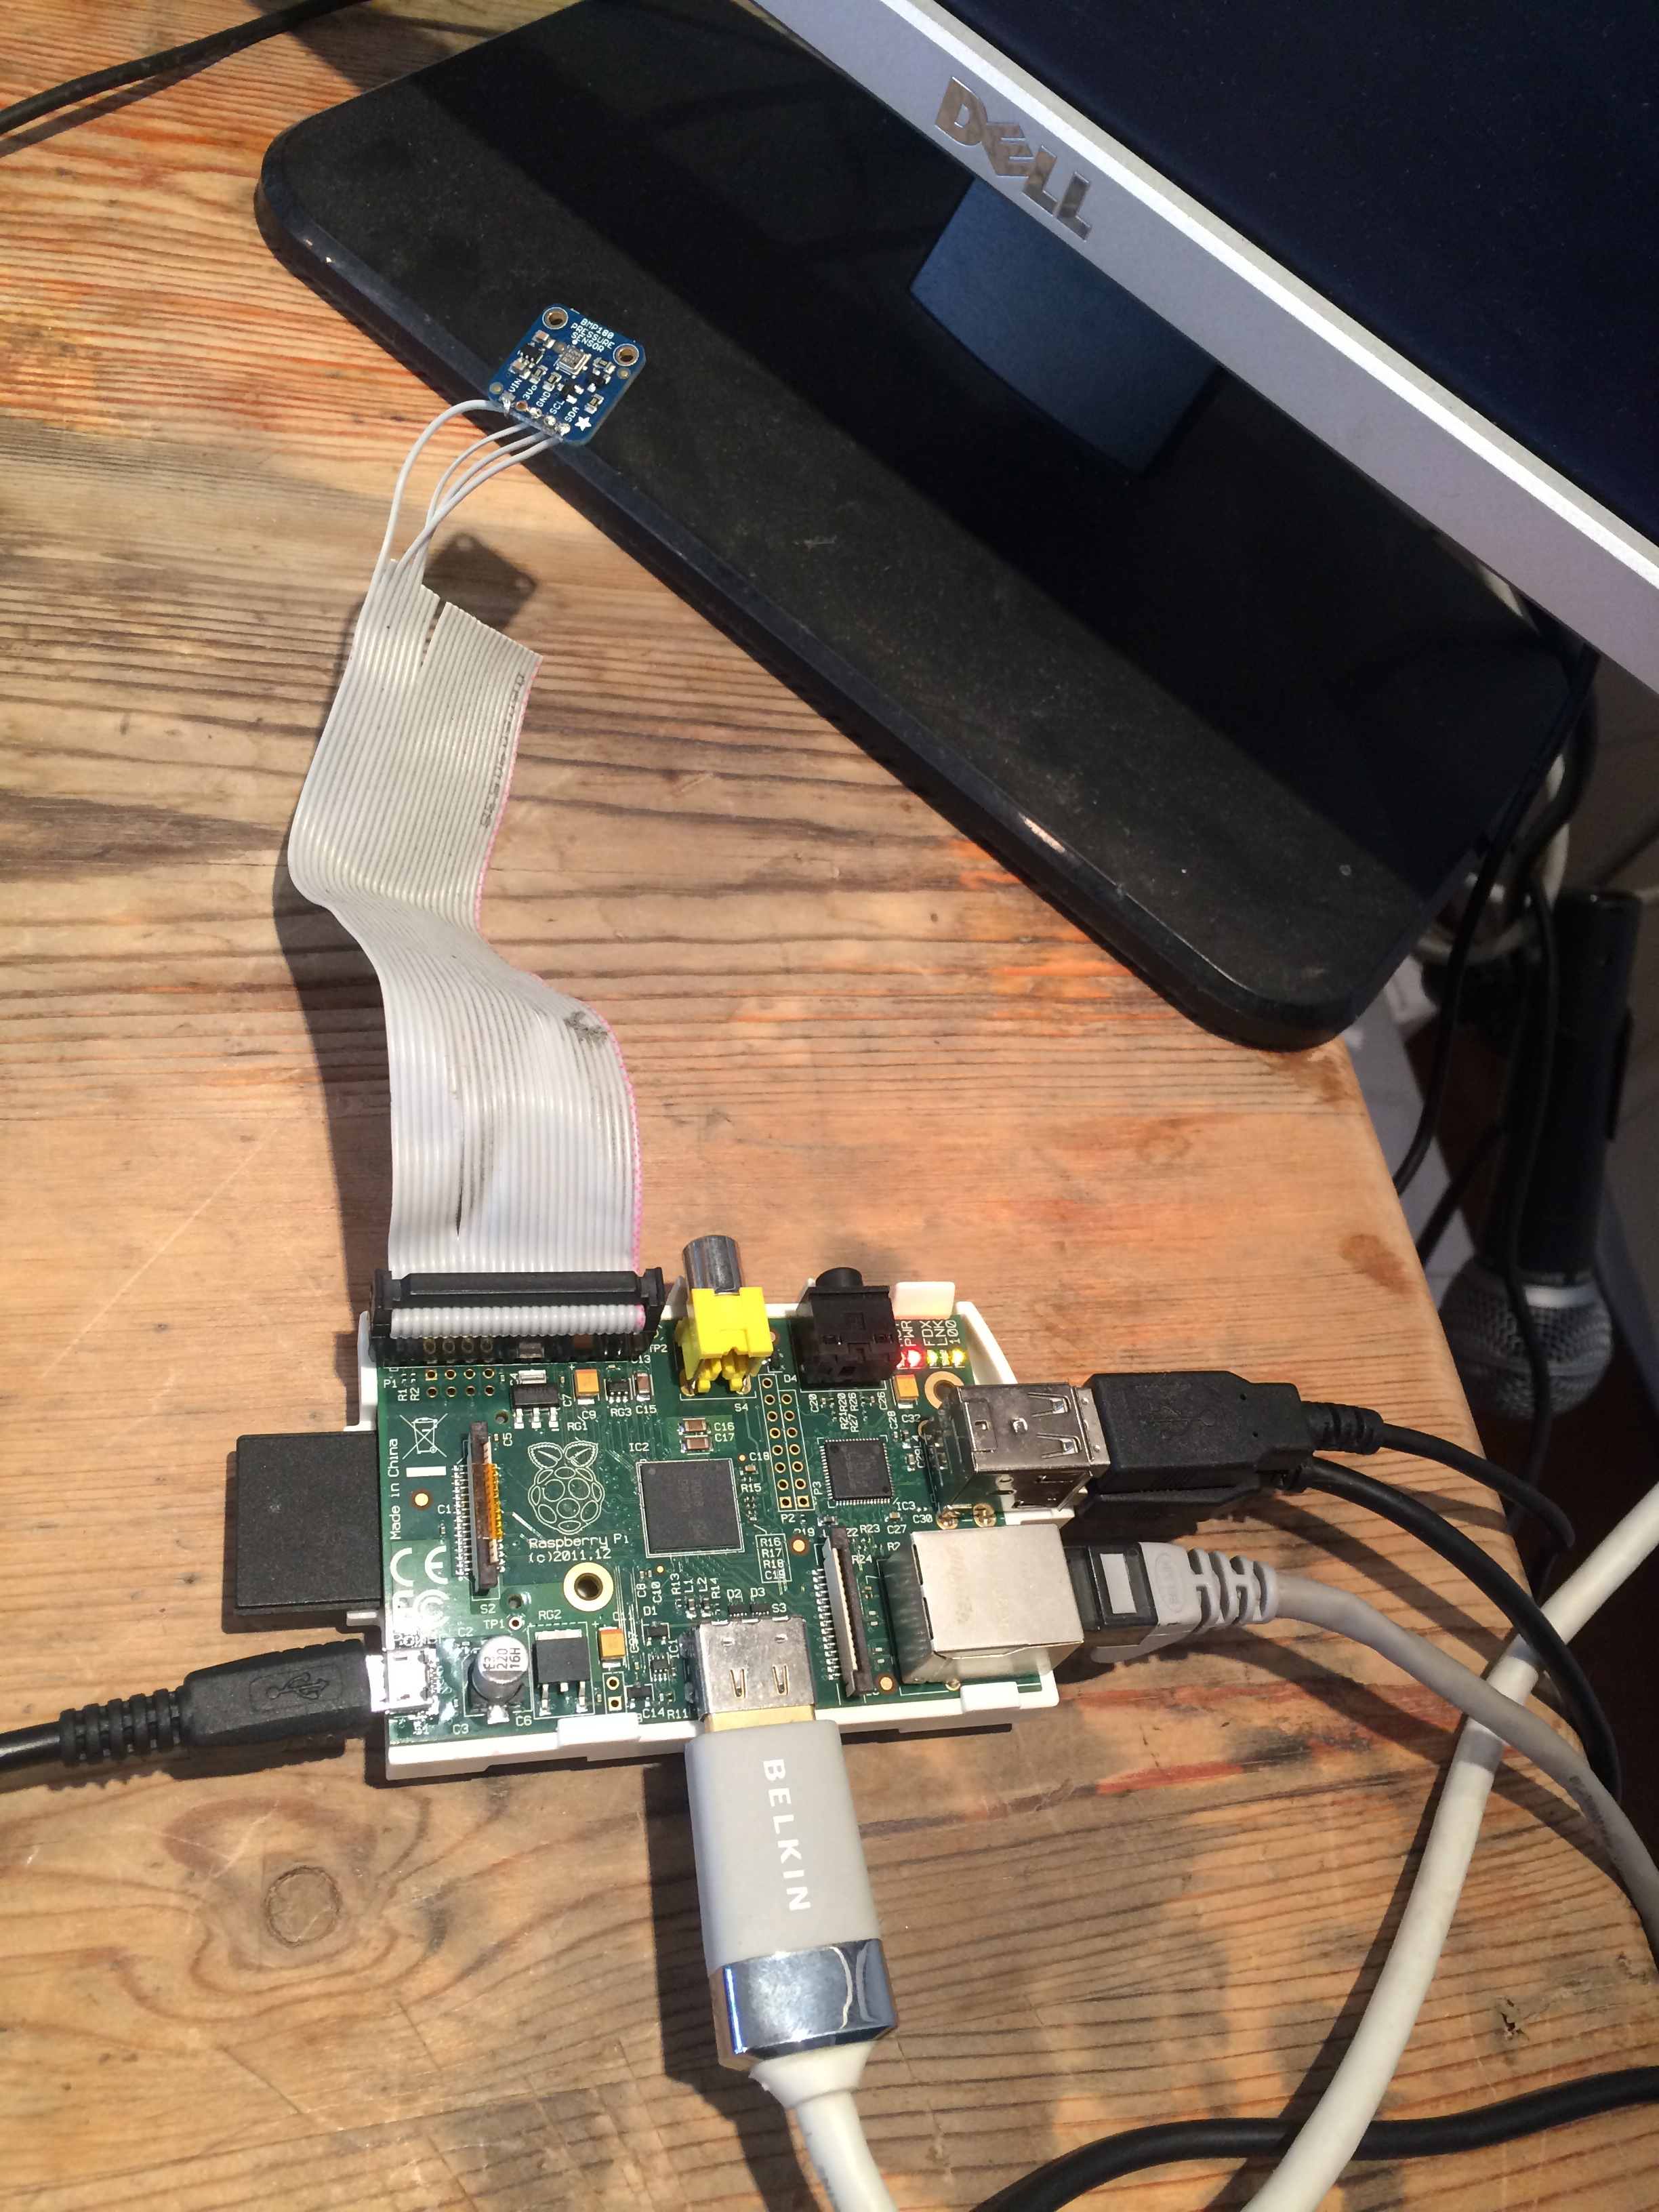
BMP180 attached to the Raspberry Pi
Originally written by Adafruit and the brilliant Sheffield Pi Weather Station project, I edited the code below to match my credentials. This resulted in data being broadcast from my studio to Plot.ly and the MET office. It’s an extremely elegant (and I use that word advisedly) bit of writing.
#These are the imports needed to get the data from the sensor.
import time
import Adafruit_BMP.BMP085 as BMP085

#These access the WOW site to upload data
import urllib
import urllib2

#SSL Solution
import urllib3.contrib.pyopenssl
urllib3.contrib.pyopenssl.inject_into_urllib3()

#Import the plot.ly data
import plotly.plotly as py
import plotly.tools as tls
from plotly.graph_objs import *

#Import the config data
import ConfigParser
import sys

def tempfarenheit(Temperature):
 #WOW requires the temperature to be uploaded in Farenheit, so this will convert our values from Celcius
 #This may not work with the DS18B20 - Needs more investigation
 Temp = (float(Temperature)*9/5)+32
 return Temp

 #I'll have to exclude this code when I use the DS18B20 as there's no presure sensor. The Bosch BMP180
 #could go in the box though?

def presinches(pressure):
 #WOW requires the pressure to be uploaded in inches of mercury, so this will convert our values from Pascals
 Pres = float(pressure) * 0.000295333727
 return Pres

def Timeformatting(aTime):
 #returns the time in both normal format and WOW format
 Timenow = time.strftime('%Y-%m-%d %H:%M:%S',aTime)
 Timeformat = Timenow.replace(':','%3A').replace(' ','+')
 return Timeformat,Timenow

def addvalue():
 #This is in case the login values have not been added already
 value = raw_input('What is your %s? ' %name)
 parser.set(section,name,value)

def Plotter():
 trace1 = Scatter(
 x=[],
 y=[],
 name = 'Temperature Readings *C',
 stream = Stream(token = Stream_ID,
 maxpoints=80)
 )
 trace2 = Scatter(
 x=[],
 y=[],
 name = 'Pressure Readings Pa',
 yaxis = 'y2',
 stream = Stream(token = Stream_ID_2,
 maxpoints=80)
 )
 my_data = Data([trace1, trace2])
 my_layout = Layout(
 title='Weather Readings from CDC Pi Weather Station', #This title should actualy have the location in it?
 xaxis={'title':'Date and Time, GMT'},
 yaxis=YAxis(title='Temperature, *C',
 ),
 yaxis2=YAxis(
 title = 'Pressure, Pa',
 titlefont={'color':'rgb(148,103,189'},
 tickfont=Font(
 color='rgb(148,103,189)'
 ),
 side = 'right',
 overlaying = 'y'
 )
 )
 my_fig = Figure(data = my_data,layout = my_layout)
 unique_url = py.plot(my_fig,filename='Weather Data from the Pi Weather Station',auto_open=False,fileopt='extend')
 s = py.Stream(Stream_ID)
 q = py.Stream(Stream_ID_2)
 return s,q

#This checks that user details exist and prompts for them if not
parser = ConfigParser.SafeConfigParser(allow_no_value=True)
parser.read('details.ini')

for section in [ 'MetWOW', 'Plotly' ]:
 for name,value in parser.items(section):
 if value:
 continue
 else:
 addvalue()

#This writes the inputted values (if any) to the file
parser.write(open('details.ini','w'))

#This assigns the values to a format that the code can now access
AWSKey = parser.get('MetWOW','aws_key')
SiteID = parser.get('MetWOW','site_id')
APIKey = parser.get('Plotly','api_key')
Stream_ID = parser.get('Plotly','stream_id')
Username = parser.get('Plotly','username')
Stream_ID_2 = parser.get('Plotly','stream_id_2')

sensor = BMP085.BMP085()
X = 0
softwaretype = "Sheffield-Pi-Weather-Station-0.1"

#Original Code for frequency of samples - (n for infinate didn't work)

#n = raw_input("No of readings (n for infinite): ")
#if float(n)>1 or n == "n":
# frequency = input('Frequency: ')

#New code for frequeency of samples...

n = raw_input("Would you like to stop after a certain amount of readings? If so, type the amount. If not, type 'Forever': ")

if n == 'Forever' or float(n)>1:

 frequency = input('What time period between readings (in seconds) would you like: ')

#Use the functions to format the plot.ly graph and login to the site

py.sign_in(Username,APIKey)
s,q = Plotter()
s.open()
q.open()
print "Press ctrl-C at any time to cancel the process"

while True:
 #Read the data
 temp= format(sensor.read_temperature())
 pressure = format(sensor.read_pressure())
 [Timeformat,Timenow] = Timeformatting(time.gmtime())

 #Get the data in the right units to upload
 Temp = tempfarenheit(temp)
 Pres = presinches(pressure)

 #Construct the URL to send the data to WOW
 url = 'http://wow.metoffice.gov.uk/automaticreading?siteid=%s&siteAuthenticationKey=%s&dateutc=%s&tempf=%s&baromin=%.2f&softwaretype=%s' % (SiteID,AWSKey,Timeformat,Temp,Pres,softwaretype)

 #Send the request to WOW and interpret response
 request = urllib2.Request(url)
 response = urllib2.urlopen(request).getcode()
 if float(response) == 200:
 print "Connection is ok, data has been uploaded to Weather Observations Website %s" % SiteID
 else:
 print "Error connecting to WOW site. Data was not uploaded at this time."

 #Write the values to the Plot.ly data stream
 s.write(dict(x=Timenow,y=temp))
 q.write(dict(x=Timenow,y=pressure))

 #Write the values to a saved file and then close that file
 f = open("data.txt",'a')
 f.write('%s %7s *C %14s Pa\n %26s *F %13.2f inch Hg\n' % (Timenow,temp,pressure,Temp,Pres))
 f.close

 #Prepare the code to run indefinitely or until required number of readings is reached
 if n != "Forever":
 X += 1
 if X >= float(n):
 s.close()
 q.close()
 break

 #Wait for the required time period before repeating
 try:
 time.sleep(frequency)
 except:
 print "Process was terminated"
 s.close()
 q.close()
 break
*Note to anyone who may want to use the SyntaxHighlighter plugin for WordPress so you can paste code into blogposts: I had to edit the source code of the plugin to get the vertical scrollbars to appear. Width stayed the same at 100%. Height I adjusted to 500px and ‘overflow-y’ was changed from ‘hidden’ to auto.
You’ll need to find the shCore.css file…
(wp-content/plugins/syntaxhighlighter/syntaxhighlighter3/styles/shCore.css)
to edit the code.
syntaxhighlighter {
  width: 100% !important;
  height: 500px;
  margin: 1em 0 1em 0 !important;
  position: relative !important;
  overflow: auto !important;
  overflow-y: auto !important;
  font-size: 1em !important;
}
Leave a Reply
You must be logged in to post a comment.