CDC: Summary
The whole project has been brilliant to work on, and it’s not finished yet! An extraordinary journey through coding, soldering, digging and the science of water. Initially I wanted to see if I could make the technology work. Could I transform a Raspberry Pi and some sensors into a weather station? Yes is the short answer, but much work needs to be done.
The Power over Ethernet system needs more work. I had the whole installation working from a battery sitting inside the containment box housing the Pi. I logged into the Pi via SSH and could read the sensor data. The power drop over 95 meters proved problematic, and there’s another 30 meters of CAT6 to the sensor in the water. All the documentation I’ve read suggests it’s possible. More testing to follow.
Solar power is another option. The long term view would have to research renewable energy for as a power source and built in GPS for transmission. Eventually the weather station boxes should be completely independent. Battery technology is evolving, so a trickle charged power source is feasible.
The i2c – 1Wire bus may be causing more problems than it’s solving. But as the intention is to use several different sensors I’m going to persevere.
Data storage needs more work. I need to design a way of getting the Pi to store readings locally but only temporarily. Long term the Pi will need to write the data to a server as it’s processed. This may be at hourly intervals for example, over writing it’s local storage each time. Long term data storage isn’t going to work on the Pi’s card, it’s not robust enough and there’s no built in redundancy if there’s a card failure.
Thermoclines is another area that hasn’t been discussed at any great length. I don’t know at this stage if Deptford Creek at high tide is deep enough to be effected by a thermocline layer, thermocline being a steep temperature gradient in a body of water such as a lake, marked by a layer above and below which the water is at different temperatures. But that’s part of the learning curve I’m going though.
The Most exciting bit has to be when we first got sensor readings on the laptop. The temperature was very consistent…
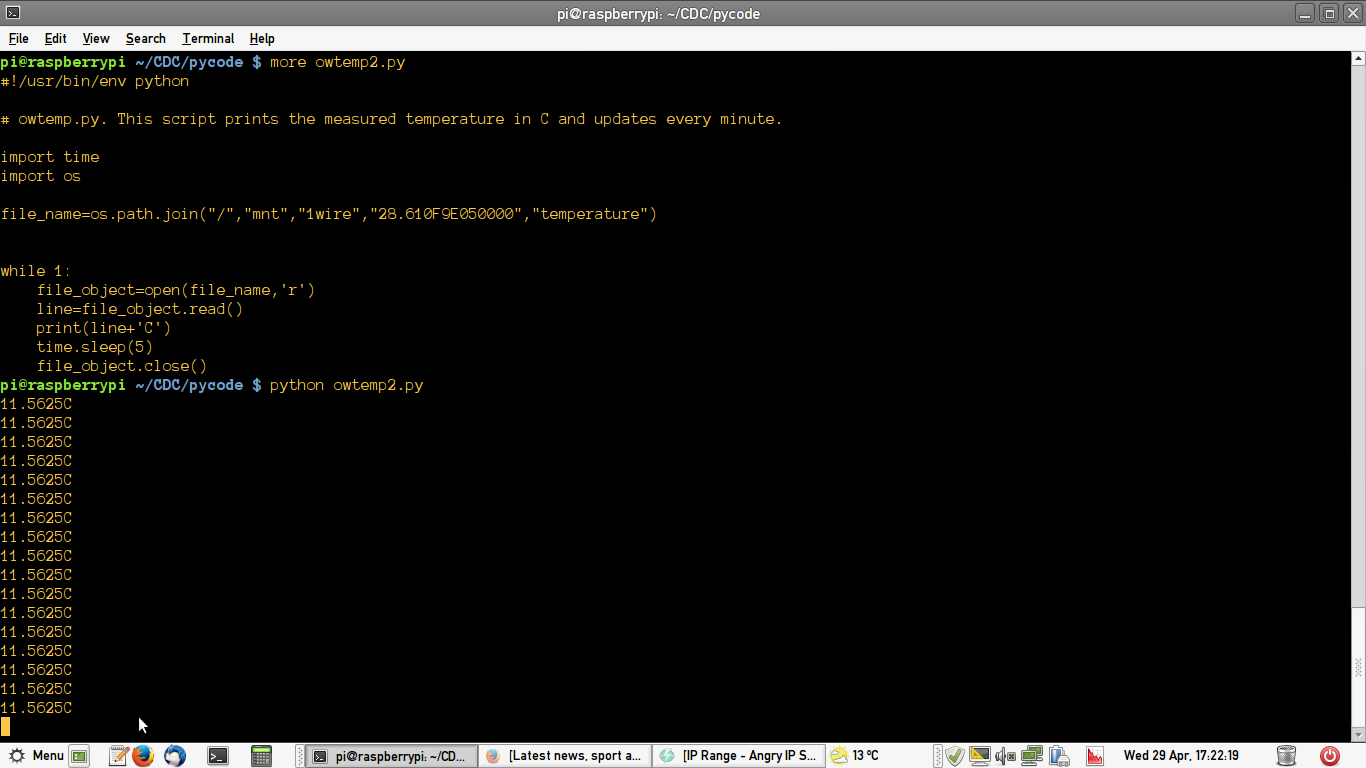
Temperature reading from the Creek
I’d asked the script to print the temperature every 5 seconds, so this list of data points represents just under a minute and a half. Firstly 11 degrees isn’t warm! One can assume this is to be expected, it’s April in England. But then again why ‘assume’ anything, the whole point of the project is to find out. What happened next confirmed we’re on the right track. As the temperature readings scrolled passed a member of staff at the Creekside Centre interrupted our celebrations, saying:
“That can’t be right. The temperature can’t be that consistent. Not to four decimal places.”
A short pause filled with the obligatory scratching of heads and momentary expressions of concern, was followed with my reply:
“Why not?”
Said member of staff looked puzzled and then replied:
“Good point. I just presumed it couldn’t be that consistent. But why would a large body of water change temperature frequently? I’m now amazed its not only so stable but to four decimal places.”
We left the script running for an hour and as the sun began to fall on a brilliant day so did the temperature, by 10th of a degree!
I am thoroughly looking forward to continuing this project.
Leave a Reply
You must be logged in to post a comment.